Debugging your code
Debugging your code
Section titled “Debugging your code”Unwinding the code trace
Section titled “Unwinding the code trace”Sometimes you want to figure out what path your code takes when getting executed. This may be helpful for investigating inconsistent behavior between function calls or finding where exactly in the bundled/minified code your function is located
// Logs the current stack trace of the code, also logs any provided parameters
/* * YOUR CODE HERE */console.trace(var1, var2);
Breakpoints
Section titled “Breakpoints”Like IDE’s, the Chrome Devtools provide a way to break and pause on certain lines of code. Here’s how you can do that:
- Open the Developer Tools (
Ctrl + Shift + I) - Go to the
Sourcestab - Reveal the left bar (if not hidden)
- Select your plugin’s code under
top > obsidian.md > plugin:XXX Pretty formatif code is all on one line- Click the line number to set a breakpoint on that line
- Run your code to start the debugger
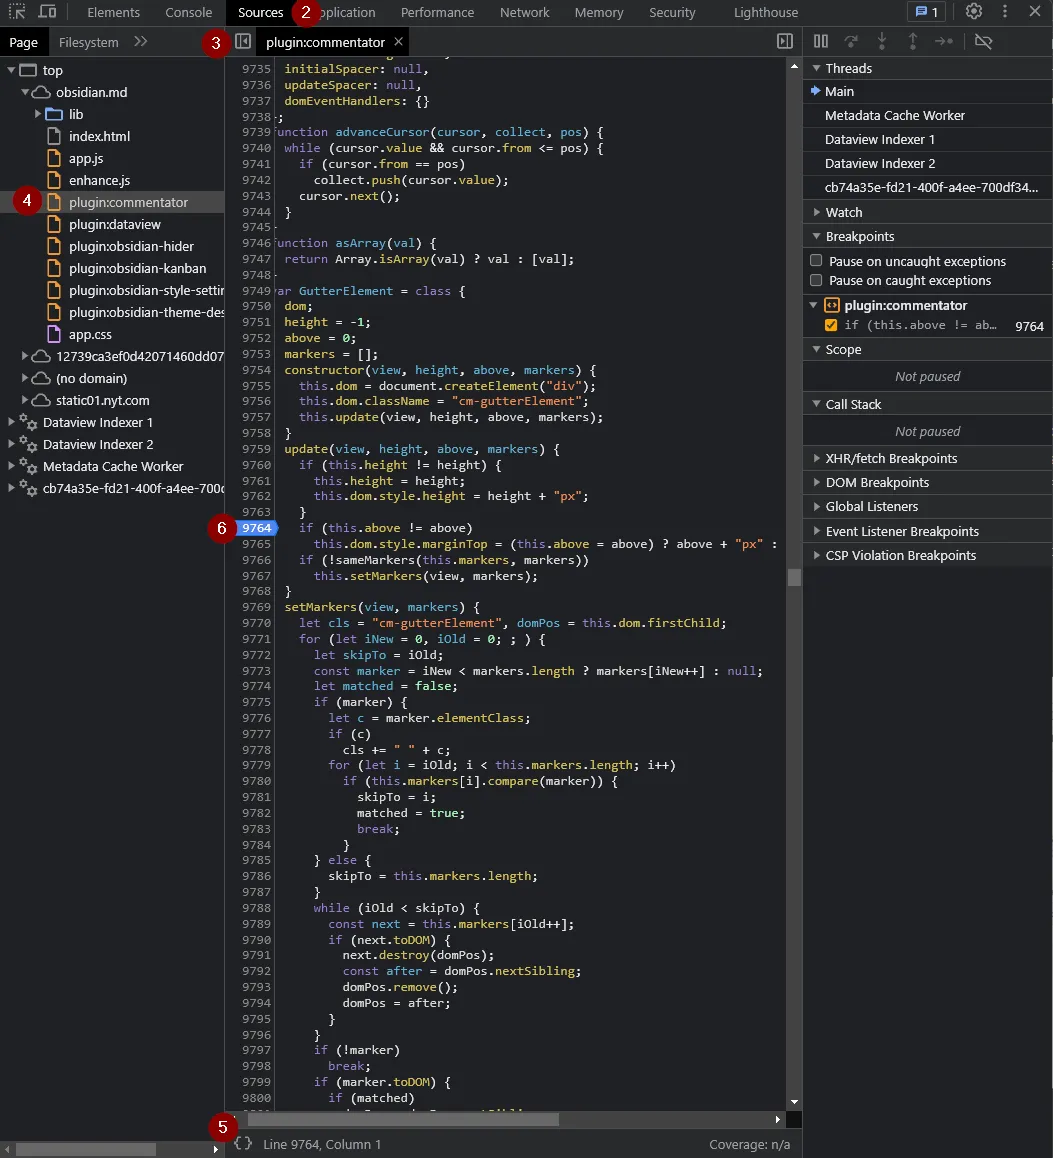
Note: from any console.log/console.trace in the console, you can directly jump to the location in the transpiled file
Alternatively, you can also programmatically add a breakpoint via:
function yourFunction() { // YOUR CODE HERE debugger; // Acts as a breakpoint}Debugging
Section titled “Debugging”If you have a breakpoint and your code gets executed, the debugger should normally get paused. Here are some things you can do in this state:
- Step to next line (
F10) - Step into the function (
F11) or out of the function (Shift + F11) - Continue code execution until the next breakpoint (
F8) - View values defined in current
Scopeand parameters - View current
Call Stack - Go to the
Consoletab, you can test and play around with the values in the current scope

Investigating performance of your code
Section titled “Investigating performance of your code”Timing your code
Section titled “Timing your code”Say you want to see how long it takes for your code to run, instead of messing about with Date.now() and then logging it, you can use the built-in commands of the console API:
// Measures execution time of code and logs it into console
console.time('label');/* * YOUR HEAVY CODE HERE */console.timeEnd('label');
Flame Charts (🔥📈)
Section titled “Flame Charts (🔥📈)”If you want more information about your code, try generating a flame chart. It displays all fired events, executed functions and visualizes the stack traces of the program (including separate threads held by web-workers).
Generating and displaying a flame chart:
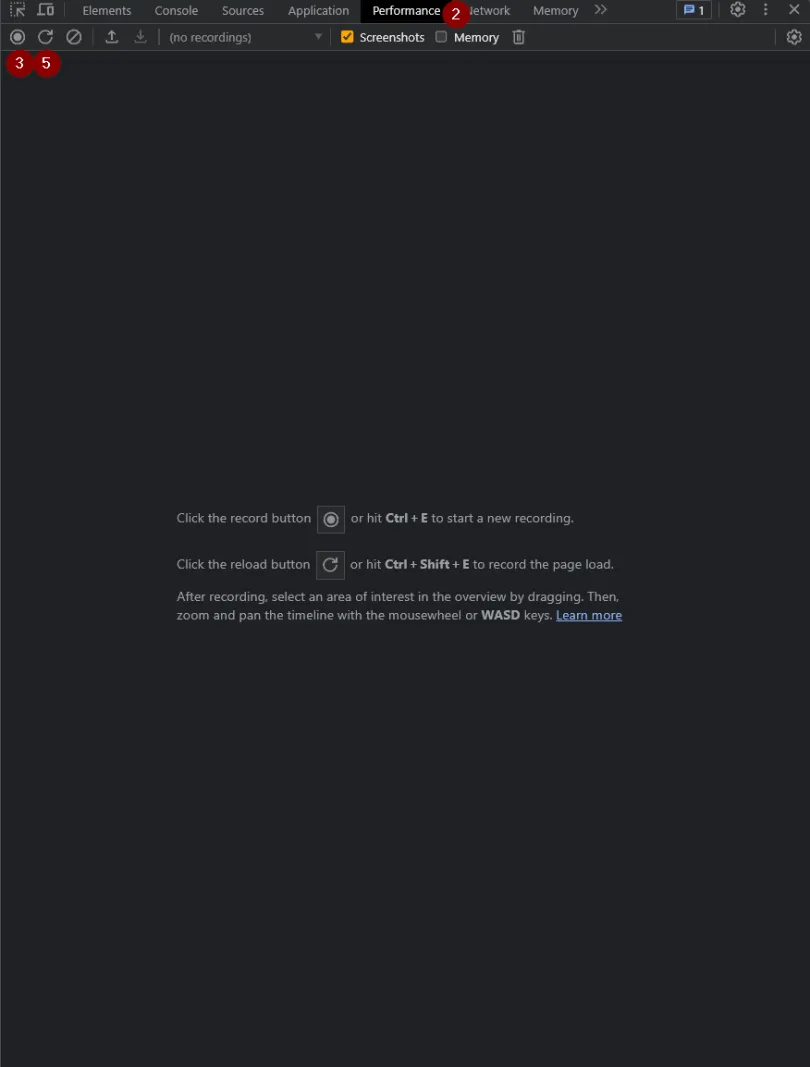
- Open the Developer Tools (
Ctrl + Shift + I) - Go to the
Performancetab (may be hidden behind the arrows) - Press the
Recordbutton orCtrl + E(leftmost button, under the devtools tabs) - Execute your code (be it command, rendering, …)
(if your code only runs on app/plugin start-up, you can run the
Reload app without savingcommand without the capture stopping - create a shortcut to this action for convenience) - Stop the recording with the same button or
Ctrl + E - Wait for the graph to render
Using the Flame Chart
Section titled “Using the Flame Chart”There’s a lot of information contained within the Performance capture, here are some important elements:
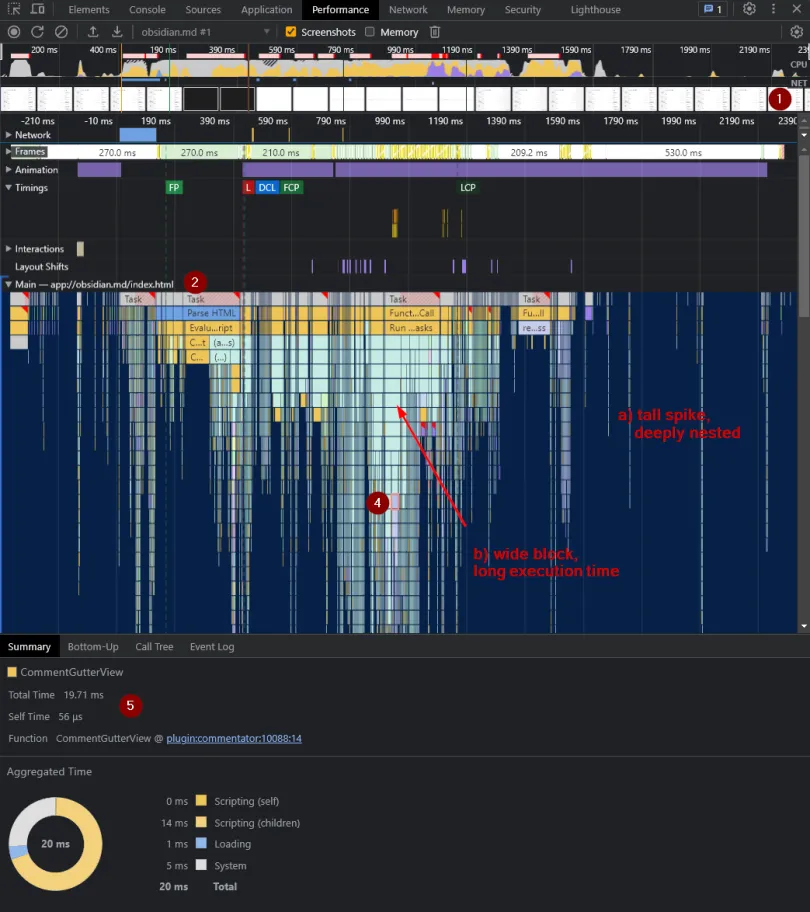
- If the
Screenshotsoption (see top bar) is enabled, you can hover over the images to view the exact look of the app at that moment in time - Under
Main, you can see all the functions that are being executed on the main thread over time. a) Tall spikes indicate a large amount of function calls (deeply nested) b) Wide blocks indicate a long execution times - Zoom into the graph to narrow the time interval
- Click on a block in the graph
- …to view information about how it was executed
Adding markings to the Flame Chart
Section titled “Adding markings to the Flame Chart”Flame charts are fantastic tools and all, but it can get quite tricky to find where and when your code is being executed - especially with dozens of other plugins running their code concurrently.
Luckily, the performance API provides a couple methods that will add markings to the graph, under Timings
// Measures execution time of code and marks it in the Performance flame chart under 'Timings'
performance.mark('start');// YOUR HEAVY CODE HEREperformance.mark('end');const code_perf = performance.measure('label', 'start', 'end');// can be used computing averages and logged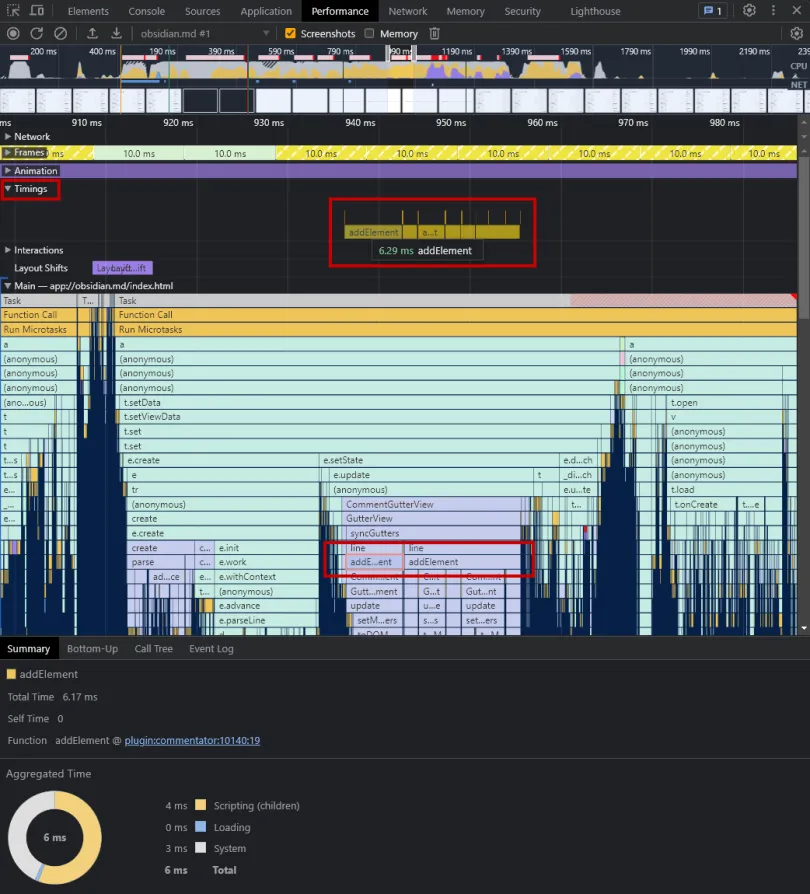
Interpreting your flame chart
Section titled “Interpreting your flame chart”As mentioned before, wide blocks are the root cause of bad performance. In the example I show (my plugin), it takes 20ms to execute a render function (as indicated by the Total Time given in the Summary.
With the chart, you can easily scroll down the flame chart (or look at the Call Tree) to see why exactly the function is performing poorly. In my case, I notice that a significant amount of time is being spent on running the MarkdownRenderer.render function.
Finally, having detected the performance hog, you can either take steps to either reduce its usage and make sure it gets called as little as possible, or write a more efficient function.
Extra tips
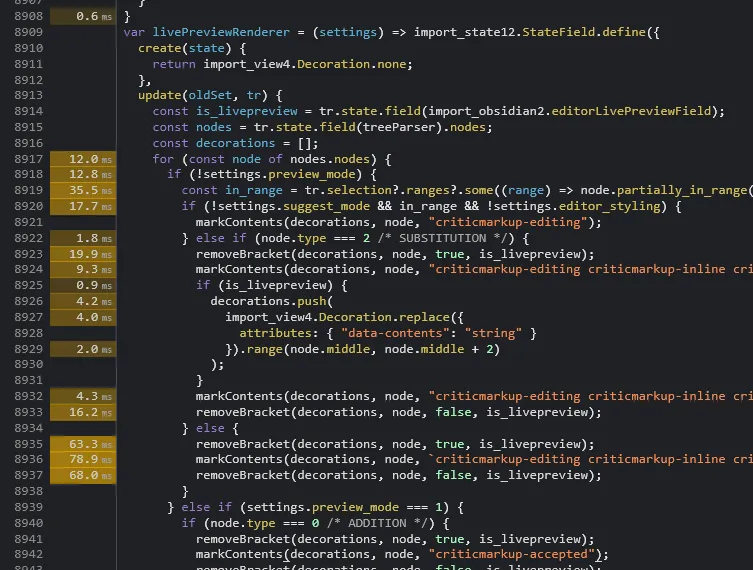
Section titled “Extra tips”When you have a Performance Snapshot, you can go to to the Sources tab that now places a duration in milliseconds next to (some) code lines, which can give an indication of how long it took to execute a particular line/function
(NOTE: it isn’t exactly documented anywhere what this duration represents)
